Diese Version enthält möglicherweise inkorrekte Änderungen. Wechsle zur letzten geprüften Version.
Was du brauchst
-
Dieser Schritt ist noch nicht übersetzt. Hilf mit, ihn zu übersetzen!
-
Perform a Sample T-test on SPSS
-
Sample T-test: Examines the evidence that the dependent variable is influenced in a meaningful way by the independent variable; if it is, then it is statistically significant.
-
Variable: An element, feature, or factor that is liable to vary or change.
-
Independent Variable: This variable varies from each statistical test and influences the dependent variable.
-
Dependant Variable: The variable that will be measured and affected by the independent variable.
-
When to use it: The sample t-test is used to examine whether a sample comes from a particular population when the full population information is not available.
-
Sample: Part of a population that is a reasonable size to be analyzed (i.e. a set of 1,000 people given a survey out of a population of 200,000).
-
Population: The overall group that a sample is taken from. It usually can’t be represented directly, but instead is represented indirectly through analysis of a sample.
-
-
Dieser Schritt ist noch nicht übersetzt. Hilf mit, ihn zu übersetzen!
-
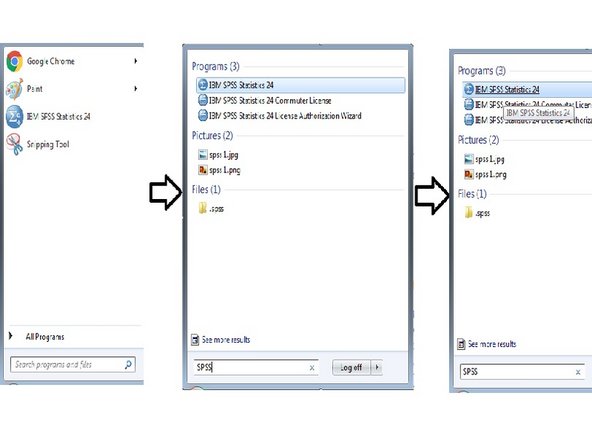
Click on the start menu of the computer in the bottom left corner of your computer.
-
Go to “All Programs.”
-
Search “SPSS.”
-
Go to “IBM SPSS Statistics."
-
Double Click on “IBM SPSS Statistics.”
-
-
Dieser Schritt ist noch nicht übersetzt. Hilf mit, ihn zu übersetzen!
-
Choose between using existing data or entering data manually.
-
Go to Step 4: "To use existing data" if you already have the data needed in another program.
-
Go to Step 5: "Enter data manually" if your data has not been entered into a program yet.
-
-
Dieser Schritt ist noch nicht übersetzt. Hilf mit, ihn zu übersetzen!
-
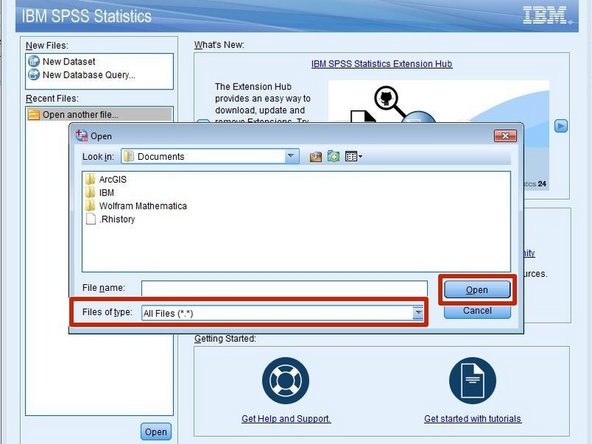
Click on "Open another file" as seen in Figure 1.
-
Click "Open" at the bottom of the window.
-
Click on the file you want to upload.
-
Click "Open" as shown in Figure 2.
-
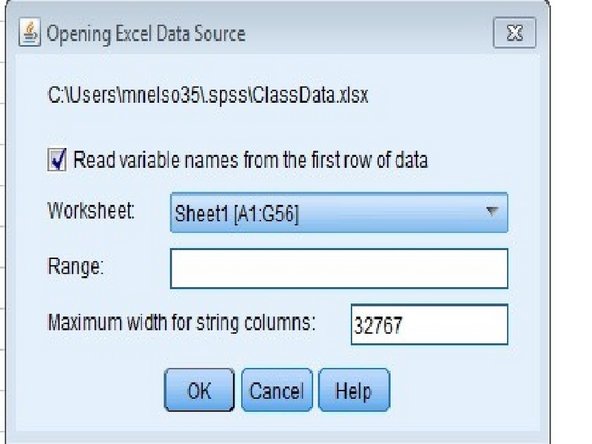
Click "OK" as seen in Figure 3.
-
Skip Step 5 and 6. Go to Step 7.
-
-
Dieser Schritt ist noch nicht übersetzt. Hilf mit, ihn zu übersetzen!
-
Click on "New Dataset."
-
Click "Open."
-
Type in data.
-
-
-
Dieser Schritt ist noch nicht übersetzt. Hilf mit, ihn zu übersetzen!
-
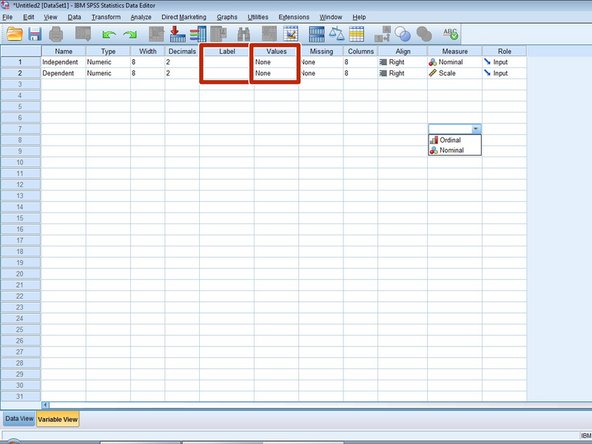
Switch to "Variable View" as shown in Figure 1.
-
Type the label of your variable into the "Label" column as shown in Figure 2.
-
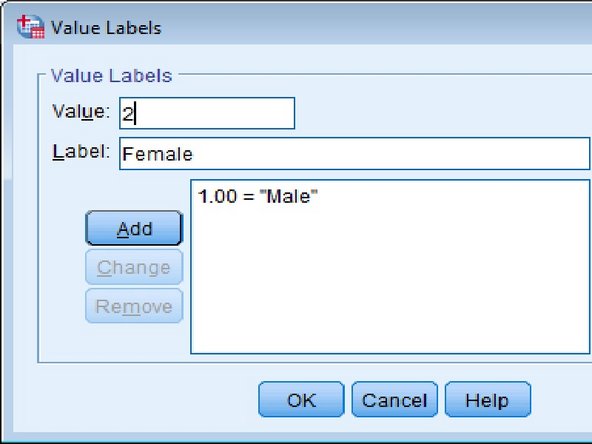
Click on the "Value" column shown in Figure 2.
-
Insert the numerical value you would like to use in the "Value" spot.
-
Enter the name that the number represents in the "Label" spot.
-
Click "Add."
-
When complete, click "OK."
-
-
Dieser Schritt ist noch nicht übersetzt. Hilf mit, ihn zu übersetzen!
-
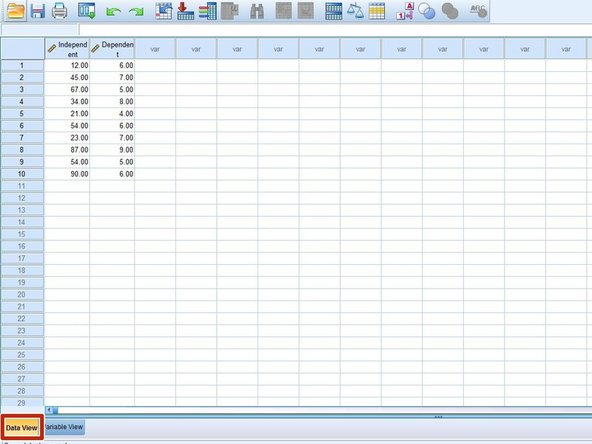
This screen shows all of the data:
-
The top row contains the names of each of the variables.
-
Each column is a different variable.
-
Each row is the data connected to an individual.
-
Click on “Variable View” at the bottom left of the page shown in Figure 1.
-
-
Dieser Schritt ist noch nicht übersetzt. Hilf mit, ihn zu übersetzen!
-
In "Variable View":
-
The first column, “Name,” states the name of the variable.
-
The second column, “Type,” indicates the data type of the variable.
-
The third column, “Width,” indicates the number of characters available for the variable values.
-
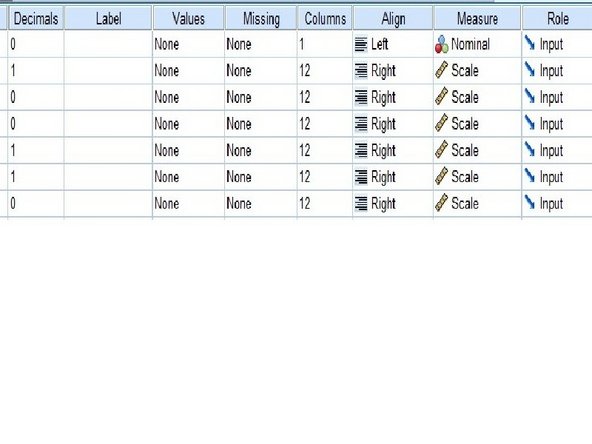
The fourth column, “Decimals,” controls the number of digits after the decimal place.
-
The fifth column, “Label,” is used to make any necessary notes.
-
The sixth column, “Values,” provides a key for what the numbers of a numeric variable represent.
-
-
Dieser Schritt ist noch nicht übersetzt. Hilf mit, ihn zu übersetzen!
-
The seventh column, “Missing,” allows a choice of including or excluding values from analysis.
-
The eighth column, “Columns,” indicates the number of columns a variable has.
-
The ninth column, “Align,” indicates the alignment of the variables.
-
The tenth column, “Measure,” indicates the level of measurement of the variable.
-
The last column, “Role,” defines the role the variable will play in the analysis.
-
-
Dieser Schritt ist noch nicht übersetzt. Hilf mit, ihn zu übersetzen!
-
Make sure you are in “Variable View” by checking the bottom left corner of your screen.
-
Put your variable name in the upper left hand cell (no spaces) and make sure the measure is set to “Scale” as seen in Figure 1.
-
Switch to “Data View” as seen in Figure 2.
-
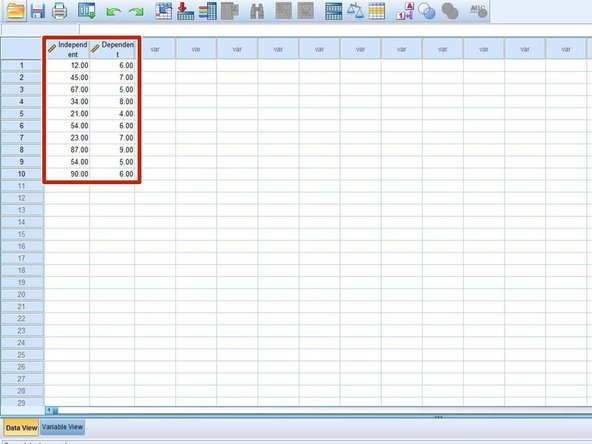
While in "Data View," plug in the data points under the column you just labeled as seen in Figure 3.
-
-
Dieser Schritt ist noch nicht übersetzt. Hilf mit, ihn zu übersetzen!
-
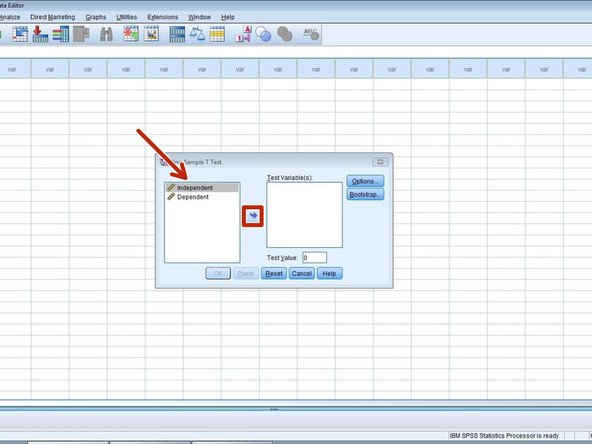
Click the “Analyze” tab in the upper left hand corner as seen in Figure 1.
-
Click on “Compare Means.”
-
Click “One Sample t-test.”
-
Move the dependent variable over using the arrow in the middle of the screen as seen in Figure 2.
-
Fill in the test value spot with the average of the population.
-
Click “OK.”
-
-
Dieser Schritt ist noch nicht übersetzt. Hilf mit, ihn zu übersetzen!
-
The first chart is the Descriptive Statistics:
-
The first column is the number of participants.
-
The second column is the mean.
-
Mean: the average of a set of values.
-
The third column is the Standard Deviation.
-
Standard Deviation: a measure of the expected deviation of the results.
-
The fourth column is the Standard Error of the mean.
-
Standard Error: the distribution of sample mean around the population mean.
-
-
Dieser Schritt ist noch nicht übersetzt. Hilf mit, ihn zu übersetzen!
-
The second chart is the t-test:
-
The first column is the t score of the data.
-
The second column is the degrees of freedom.
-
The third column is the sig value of the data.
-
P-value / sig.: The number that says where on a standard bell curve a value needs to be in order to be statistically significant [ex.: p-value of .05 means that a value must be outside the middle 95% of a bell curve to be statistically significant] (if we use this, we should probably have an image with it)
-
The final columns are the ranges inside the confidence intervals.
-
Confidence Interval Range: an interval that consist of a range of values that are likely to have the unknown parameter.
-
-
Dieser Schritt ist noch nicht übersetzt. Hilf mit, ihn zu übersetzen!
-
Determine whether to reject the null hypothesis by looking at the sig value. If the sig value is less than the alpha value, the null hypothesis is rejected. Another way to determine whether to reject the null hypothesis is by looking at the confidence intervals. If 0 is not within these intervals, you can reject the null hypothesis.
-
Alpha Value: the probability of rejecting the null hypothesis given that it is true; often equal to the p-value
-
Null Hypothesis: the idea that there is no significant difference between specified populations, any observed difference being due to sampling or experimental error
-
Alternative Hypothesis: the idea that there is a significant difference between specified populations, any observed difference being due to a changed variable
-
-
Dieser Schritt ist noch nicht übersetzt. Hilf mit, ihn zu übersetzen!
-
To interpret the results, look at the p-value and the alpha value. If the p-value is less than the alpha value, the null hypothesis is rejected. If the p-value is greater than the alpha, the null hypothesis is accepted.
-
Write your results out on a research document like this: "It is not significant. M = 48.70, SD = 27.01461, t(9) = 5.701, p < .00, alpha = .05."
-
M: mean
-
SD: standard deviation
-
t(9): "t" means t-test; "(9)" is the degrees of freedom, which is 9 in this case
-
p: p-value
-
alpha: alpha value
-
Write this for each of the independent and dependent variables.
-


Rückgängig: Ich habe diese Anleitung nicht absolviert.
3 weitere Nutzer:innen haben diese Anleitung absolviert.

Team
